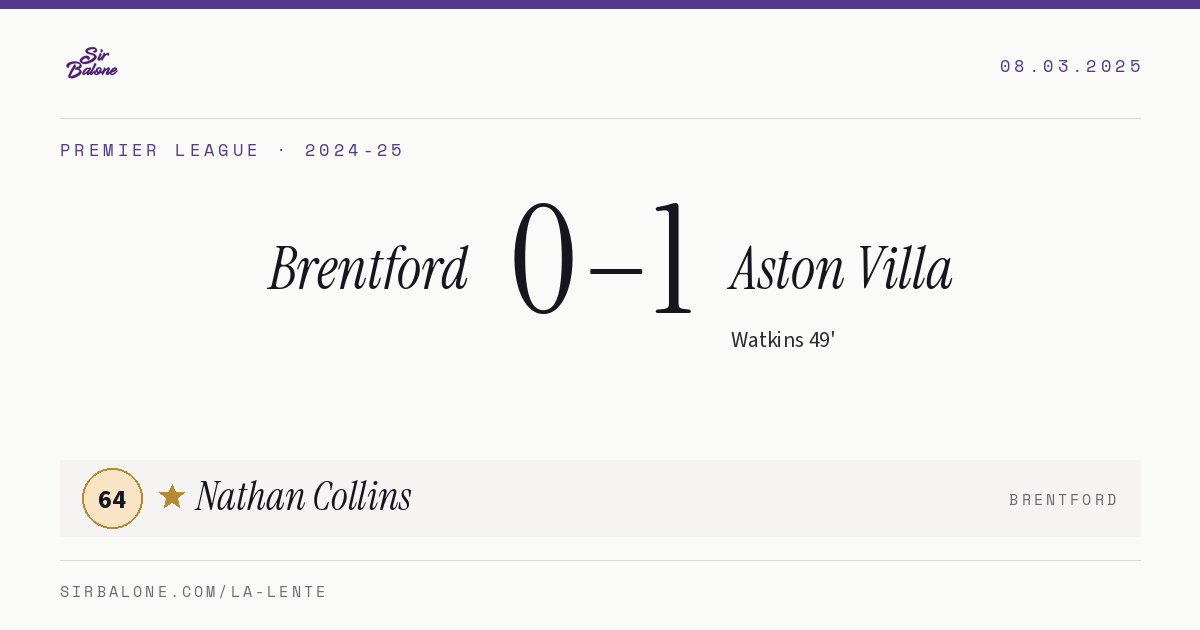
Brentford 0–1 Aston Villa
- Watkins 49'
8 March 2025
The match in data
Aston Villa beat Brentford 1–0 on 8 March 2025, on matchday 28 of the 2024-25 Premier League.
Player of the match: Nathan Collins (Brentford), rated 64, thanks above all to 5 aerials won and 7 final-third passes. Collins produced 1.1 times as much as a defender typically does, at 0.4 times the cost.
For Aston Villa, the highest-rated player was Robin Olsen, with 60.
Nathan Collins
Brentford · 90'
Produced 1.14× and cost 0.37× their position's average
- 5 aerials won 3.2×
- 7 final-third passes 1.2×
- 7 duels won 1.6×
- 3 duels lost 0.8×
- 4 misplaced passes 0.6×
Match ratings
Everyone who played, sorted by rating. No rating: anyone who played under 20 minutes, and a goalkeeper who did not play the whole match.
| Player | Position | Min | Rating |
|---|---|---|---|
| Nathan Collins ★ | Defender | 90 | 64 |
| Christian Nørgaard | Midfielder | 90 | 60 |
| Mikkel Damsgaard | Midfielder | 90 | 60 |
| Ethan Pinnock | Defender | 90 | 57 |
| Keane Lewis-Potter | Forward | 90 | 56 |
| Kristoffer Ajer | Defender | 90 | 44 |
| Yoane Wissa | Forward | 90 | 43 |
| Vitaly Janelt | Midfielder | 75 | 43 |
| Kevin Schade | Forward | 90 | 40 |
| Bryan Mbeumo | Forward | 90 | 39 |
| Mark Flekken | Goalkeeper | 90 | 39 |
| Mathias Jensen | Midfielder | 15 | no rating |
| Ji-soo Kim | Defender | 1 | no rating |
| Player | Position | Min | Rating |
|---|---|---|---|
| Robin Olsen | Goalkeeper | 90 | 60 |
| Tyrone Mings | Defender | 90 | 59 |
| Youri Tielemans | Midfielder | 90 | 56 |
| Ollie Watkins | Forward | 90 | 54 |
| Ezri Konsa | Defender | 90 | 49 |
| Morgan Rogers | Midfielder | 90 | 40 |
| Axel Disasi | Defender | 90 | 39 |
| Boubacar Kamara | Midfielder | 29 | 39 |
| John McGinn | Midfielder | 61 | 38 |
| Jacob Ramsey | Midfielder | 68 | 35 |
| Matty Cash | Defender | 44 | 33 |
| Lucas Digne | Defender | 90 | 31 |
| Marcus Rashford | Forward | 22 | 31 |
| Leon Bailey | Forward | 46 | 28 |
| Donyell Malen | Forward | 1 | no rating |
Did you know?
La Lente trivia questions about this match. Tap one to see the answer.
Which Aston Villa player won the most duels?
Axel Disasi, with 8 duels won. Next: Tyrone Mings 6, Ezri Konsa 5.
Axel Disasi led Aston Villa's defensive stand with 8 duels won in the narrow 0–1 victory. Tyrone Mings added 6 and Ezri Konsa won 5 to help secure the clean sheet.
Which Brentford player recovered the most balls?
Christian Nørgaard, with 10 recoveries. Next: Nathan Collins 6, Bryan Mbeumo 5.
Christian Nørgaard led Brentford's defensive effort with 10 ball recoveries in the 0–1 loss. He finished well clear of Nathan Collins with 6 and Bryan Mbeumo with 5.
How is the rating calculated?
The rating measures a single match: what the player produced against what they cost, compared with the average for their position in that league and season, and adjusted by position (a 70 for a forward is as hard to get as a 70 for a defender). A normal match is around 50, 70 is already very good and only one in a hundred goes above 80. It is not the NVP, which ranks the whole season.
Share this match